Everything you need to know about Tableau

At its core, Tableau is a powerful and flexible data visualization and business intelligence tool. It was founded on the principle of making data accessible and understandable to a wide range of users, from data analysts to business executives. Unlike traditional BI tools that often require extensive coding or specialized technical knowledge, Tableau’s strength lies in its intuitive drag-and-drop interface, which allows users to create complex visualizations with relative ease.

Tableau’s architecture is designed for performance and scalability. It can connect to a vast array of data sources, from simple spreadsheets to complex cloud databases and big data platforms like Hadoop. Once connected, Tableau processes and visualizes this data in a highly efficient manner, leveraging a technology called VizQL™ (Visual Query Language). VizQL translates user interactions, like dragging a field onto the canvas, into a query that retrieves and renders the data visually, making the process of data exploration incredibly fast and fluid.

The core components of the Tableau ecosystem

The Tableau platform is more than just a single application. It’s a suite of products designed to handle every stage of the data analytics workflow, from data preparation to sharing insights.

1. Tableau Desktop

This is the foundational component for building visualizations and dashboards. Tableau Desktop is a robust authoring application where analysts connect to data sources, perform data modeling, and create reports. It offers a rich set of tools for creating different chart types, from basic bar charts to intricate geographic maps and network diagrams. The work created here can be saved as a workbook file (.twb) or a packaged workbook (.twbx), which bundles the data and visualizations together.

2. Tableau Server / Tableau Cloud

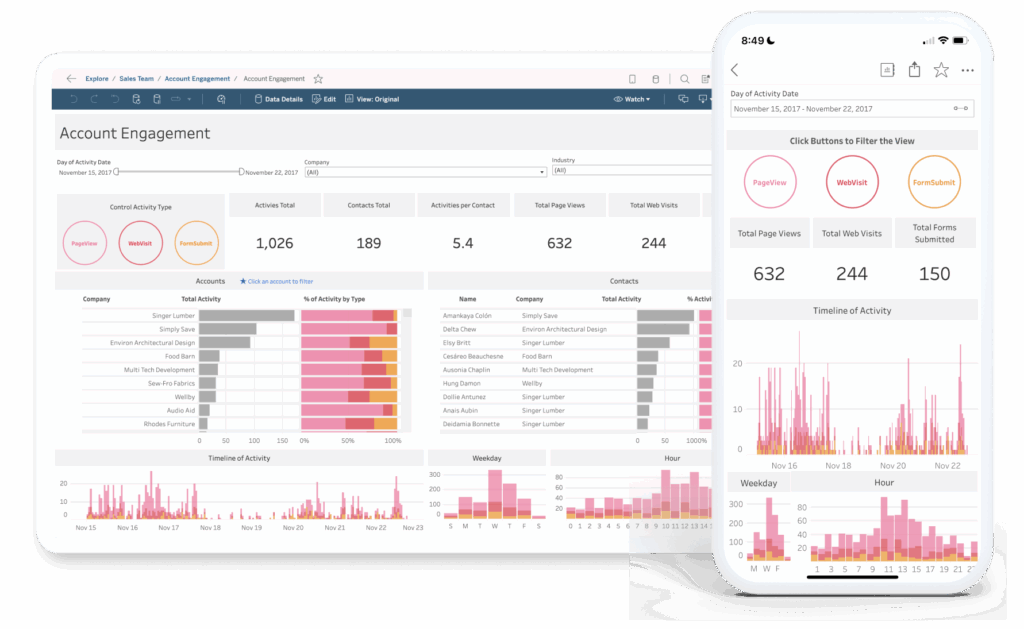
These products are the enterprise solutions for sharing and collaborating on Tableau content. Tableau Server is a self-hosted platform, giving organizations full control over their infrastructure, security, and scalability. Tableau Cloud (formerly Tableau Online) is a fully hosted, managed service that eliminates the need for maintaining hardware. Both platforms allow users to publish dashboards, manage data connections, and set up data refresh schedules. They are crucial for democratizing data, allowing stakeholders across an organization to access up-to-date, interactive dashboards via a web browser or mobile app.

3. Tableau Prep

Tableau Prep is a dedicated tool for data preparation. Before data can be effectively analyzed, it often needs to be cleaned, transformed, and shaped. Prep helps analysts perform these tasks visually. Users can see a flow of their data transformation steps, including joins, pivots, aggregations, and data cleaning operations. This “visual flow” approach makes it easy to understand the logic of the data preparation process and share it with others, ensuring consistency and accuracy in the analytical pipeline.

4. Tableau Public

For a more community-driven and free experience, Tableau Public is a platform where users can create and share interactive data visualizations with the world. It’s an excellent way for beginners to learn Tableau and for professionals to showcase their portfolios. While it has some limitations (e.g., visualizations are public by default), it’s a powerful tool for exploring data and engaging with a global community of data enthusiasts.

Image from Tableau.

Applications in Data Analytics: from raw data to actionable insights

Tableau’s power shines brightest in its ability to bridge the gap between raw data and meaningful business decisions. Its applications in data analytics are vast and varied.

1. Exploratory Data Analysis (EDA)

EDA is the process of examining a dataset to summarize its main characteristics, often with visual methods. Tableau excels at this. Analysts can connect to a new dataset and quickly drag fields onto the canvas to see distributions, identify outliers, and discover unexpected patterns. This interactive process allows for rapid hypothesis testing and a deeper understanding of the data before formal modeling begins.

2. Dashboards and Reporting

The most common use of Tableau is creating interactive dashboards. A well-designed dashboard combines multiple visualizations to tell a comprehensive story about a business process or a key performance indicator (KPI). For example, a sales dashboard might include a bar chart of sales by region, a line chart of sales over time, and a map of customer locations, all linked together so that filtering on one visualization updates the others. This empowers users to drill down into specific details without needing to build new reports.

3. Business Intelligence and Performance Monitoring

Organizations use Tableau to build operational dashboards that monitor real-time performance. Executives can view a company’s financial health, sales teams can track their quotas, and marketing departments can analyze campaign effectiveness. By providing a single source of truth and automating data refreshes, Tableau ensures that everyone in the organization is working from the same, most current information.

4. Advanced Analytics Integration

While Tableau is not a statistical modeling tool in itself, it integrates seamlessly with advanced analytics platforms. It can connect to external services like Python (via TabPy) or R (via Rserve) to execute more complex statistical models, like forecasting or clustering, and then visualize the results directly within Tableau. This allows data scientists to leverage their coding skills while still providing a user-friendly, visual interface for the business.

5. Geospatial Analysis

Tableau has robust geospatial capabilities. It can automatically recognize geographical data (like city names or zip codes) and plot them on a map. Analysts can create choropleth maps to show data density, analyze customer distribution, or visualize logistical routes. This makes complex location-based insights simple to create and understand.

Why Tableau is a game-changer

Tableau’s success is not just about its features but also its philosophy. It champions a visual-first approach to data analysis, which taps into the way humans naturally process information. Instead of wading through tables of numbers, users can see trends, spot outliers, and identify correlations instantly. This visual intuition accelerates the entire analytical process, transforming data from a static resource into a dynamic asset for driving business strategy.

In a world where data is constantly growing, the ability to quickly and effectively make sense of it is a significant competitive advantage. Tableau provides the tools to do just that, empowering users at every level to ask better questions, discover new insights, and ultimately, make more informed decisions.

Frequently Asked Questions (FAQ)

I will add a FAQ section and a call to action at the end of the previous blog post.


Frequently Asked Questions (FAQ)


Q: Is Tableau difficult to learn? A: Tableau’s strength is its intuitive, visual interface. While there is a learning curve to master advanced features, beginners can create meaningful visualizations and dashboards very quickly. Many resources, including free training videos, are available to help users get started.

Q: How does Tableau handle large datasets? A: Tableau is built to handle large volumes of data efficiently. It can connect directly to your data source in real-time (Live Connection) or extract the data into a high-performance, in-memory format called a Tableau Data Extract (.hyper file). Extracts are highly optimized for speed and are often the preferred method for working with very large datasets.

Q: What is the difference between Tableau Desktop, Server, and Cloud? A: Tableau Desktop is the authoring tool for creating visualizations and dashboards. Tableau Server is a self-hosted platform for sharing and collaborating on these dashboards within an organization. Tableau Cloud is the cloud-based, hosted version of Tableau Server, which simplifies management and accessibility.

Q: Can Tableau connect to any data source? A: Tableau has a wide range of native connectors that allow it to connect to hundreds of different data sources, including spreadsheets, relational databases (like SQL Server, Oracle), cloud services (like Amazon S3, Google BigQuery), and big data platforms (like Hadoop). If a native connector isn’t available, you can often connect via a generic ODBC connection.

Ready to transform your data into actionable insights?

Harness the full power of Tableau to drive your business forward. Our team of certified specialists can help you design and implement a data analytics solution tailored to your unique needs.

Click the banner below to speak with an expert and start your data transformation journey today!

Don't miss any of our content

Sign up for our BIX News

Our Social Media

Most Popular

Want expert help with your data stack?

From Snowflake to Power BI, our team can help you make the most of your tools.Get a free consultation – no commitment.