The Human Resources Department is responsible for the greatest asset of any company: people. This job has the responsibility of hiring the right people, training them, evaluating their performance, solving problems between them, and helping to monitor career progression. We know that all these tasks demand time and resources, which can be very scarce.
However, it is possible to leverage your HR with People Analytics, which uses technology to automate processes, analyze data and decide more quickly and effectively. In this article, we will briefly discuss key performance indicators (KPIs) related to human resources and how we can use Microsoft Power BI to track them.

People Analytics
People Analytics can be seen as using software, data analysis, and other technology-related tools to ensure better hiring, more employee productivity, and better-connecting people strategy to business strategy. Through it, it is possible, for example, for leaders and managers to understand the cost of hiring and training an employee, the cost of a sudden layoff, how engaged employees are in their jobs, and so on.
In a world where everything is becoming increasingly digital and increasingly digital, it is essential to have the support of technologies that allow processes such as People Analytics to be effective and data to support your decisions.
KPIs in People Analytics
Key Performance Indicators (KPIs) are everything when it comes to measuring the success of a business. Thinking about People Analytics, we have many metrics and KPIs to calculate, but let’s list some of them to clarify:
- Absenteeism Rate;
- Benefits Satisfaction Index;
- Costs for Training;
- Costs with Overtime;
- Turnover;
Nowadays, with the complexity of processes within a company, it is almost impossible to successfully manage a high-performing team and track these KPIs without the support of technology. Now you might be wondering how we analyze the result of a training session.
Or even wondering if it is possible to quantify the engagement and satisfaction of my employees? And how does seniority relate to productivity anyway?
These questions are quite common and can be answered with a single report created with Microsoft Power BI.
Power BI: the greatest ally to empower your analysis
Simply and objectively, Microsoft Power BI is Microsoft’s Business Intelligence tool. In a league of its own, this software connects to 250 data sources and transforms them into stunning visualizations that help guide your business decisions. Let’s take a look at the type of reports we can create with Power BI to empower your HR department.
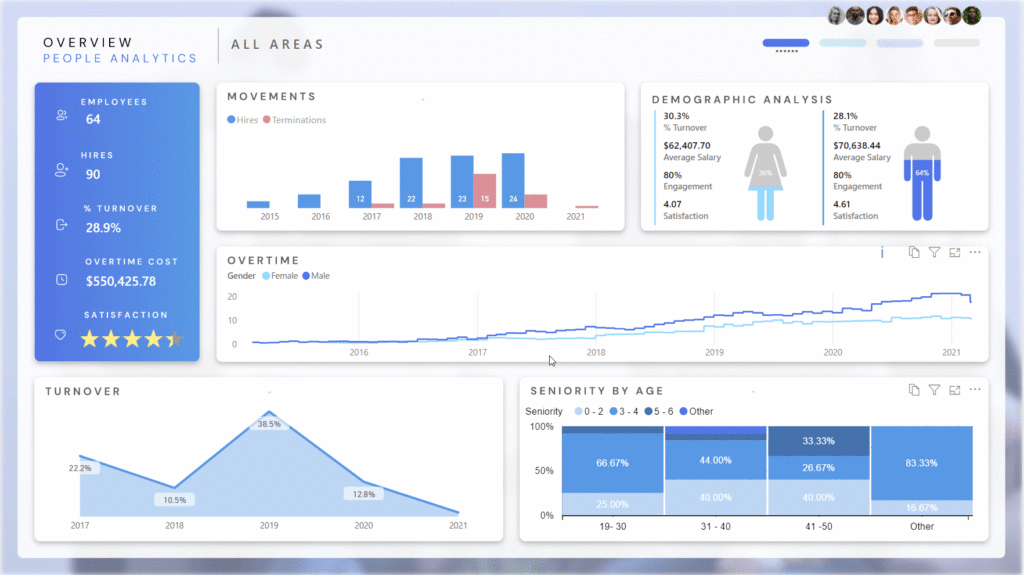
An overview of KPIs by date, area, and seniority.
You can see from the gif above that the company is growing very fast, with more and more people being hired over time. There is also an increase in total overtime hours, which is to be expected. By clicking on one of the photos, we are selecting a manager and his area, and all KPIs adjust accordingly.
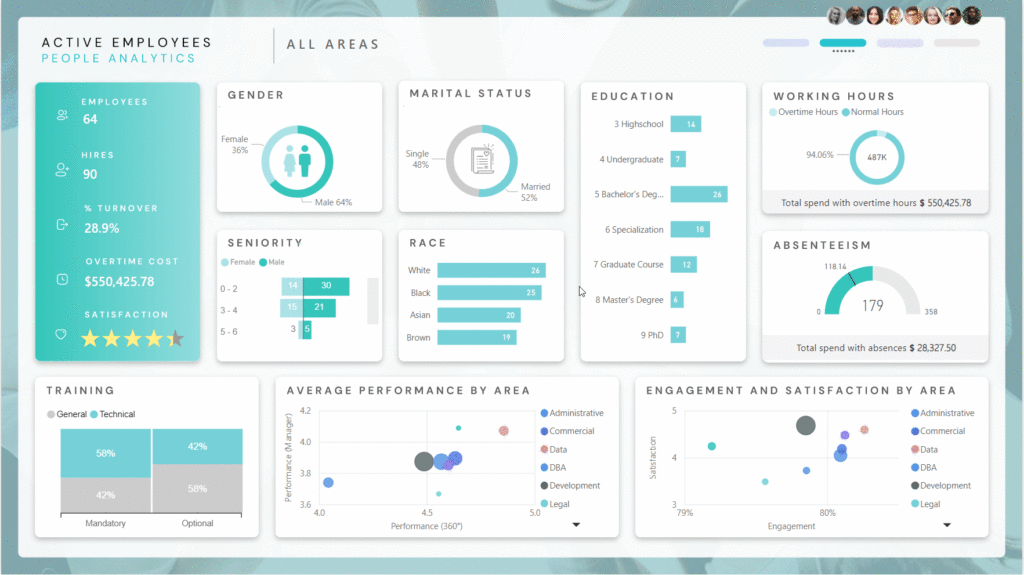
A page dedicated to Active Employees.
At the same time, it is possible to analyze the current workforce and rank different areas based on their performance and engagement. This gives you a quick and effective way to see where adjustments are needed.
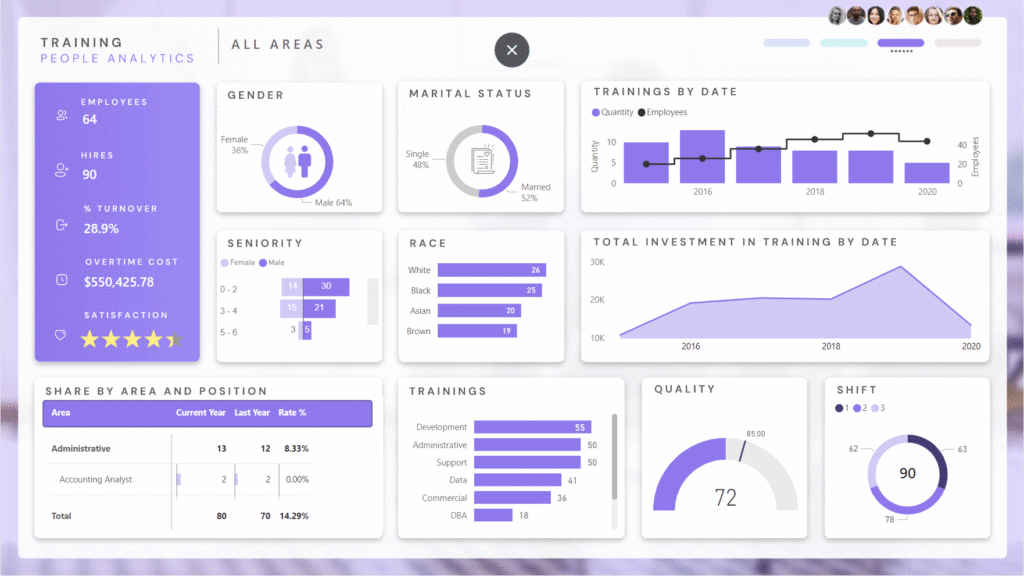
A page where we can analyze training data.
When you click on any visualization, Power BI quickly filters the data for all other visuals. As such, this tool is understood by experts to be extremely powerful when analyzing data segments to answer specific questions. On this training page, for example, we can look at the total investment in training just for women and see which department has the most training.
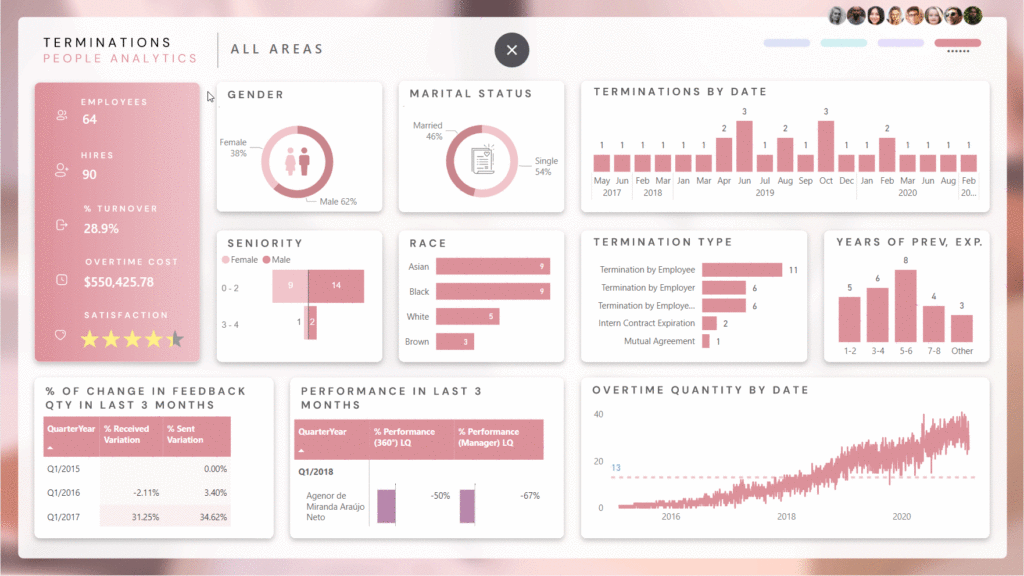
A complete review of terminations.
Conclusion
With this last page, for example, you can analyze whether there is a link between gender and the type of termination, whether the employees who left voluntarily worked the longest hours, and so on. It is very important to understand why employees are leaving to act quickly and maintain a higher retention rate.
Imagine that you had all these KPIs and many more updated hourly, with each manager having secure access to only their team’s data, in a fully interactive report, in a fully automated process. It is a big step towards leveraging your HR with technology and Business Intelligence, without the need to transform and clean data to build reports.
If you need to implement People Analytics in your company and want to use Power BI for this, count on BIX Tech. Our specialists are ready to help you with this task with the best technologies on the market.
Click here and schedule a meeting with one of our consultants.
If you want to get in touch with the amazing professional who wrote this article, feel free to reach out to Felipe José Santos on his LinkedIn profile.


